At Kurek Tool, we are very aware we are a service business. Our customers value:
- Fast turn-around (sometimes in a few hours for emergency orders),
- Accuracy (they get what they want every time),
- On time delivery (we have 97% on-time delivery performance),
- Fair pricing,
- Accommodating service (we’ll bend over backwards to meet your needs)
Some years ago, we installed a Weekly Performance Report (WPR), created by Vince Bozzone of Delta Dynamics. This report provides information on key metrics we determined were critical for running our business and providing the best possible customer service. Each metric is entered into the WPR every week and individual graphs for each show trends over time. The report also compares the current week to an average week; shows year-to-date performance; and projects year-end results if we continue to perform at the current level.
So what do we measure? The WPR is broken down into a 5 major sections.
In the Marketing and New Business Development Section, we measure:
- New Prospects Contacted
- Existing Customers Contacted
- RFQ’s Received from New Customers
- RFQ’s Won from New Customers
- New Dollars Quoted
- New Quoted Orders Booked
These metrics keep us on track when it comes to the effort required to identify and secure new customers, as well as to make sure we are keeping in touch with current customers in order to address any needs or concerns they may have. We track dollars quoted and won from new customers to ensure our efforts to solicit new business are effective.
In the Competitive Performance Section, we measure:
- Number of RFQ’s Received
- RFQ’s Not Quoted
- Number of Quotes Won
- Quotes Sent Late
- Number Won/Quoted
- Dollars Quoted
- Dollars Won
- Percentage $ Won/Quoted
We “no quote” orders for a variety of reasons:
- Delivery (can’t make the customer’s required delivery date)
- Technical Inability (work too large)
- Materials Related
- Customer Related (no specs, bad print)
- Other
Note: We would rather no quote an RFQ when we cannot meet a customer’s required delivery date vs. take the order and disappoint the customer.
Our policy is to convert RFQ’s into quotes within 24 hours. If a quote falls outside this time frame, we count it and monitor our performance. Metrics in this section of the WPR also let us know if our pricing is competitive overall.
We break dollars quoted and won down further by customer periodically to determine how much we are winning from individual customers. If we are quoting a lot and winning a little or none, we call to see if there is a problem or other cause for not winning orders from this customer.
In the Production, Productivity, & Quality Section we measure:
- Rework Hours
- Rework Costs and Lost Revenue
- Order Backlog
- Dollars Shipped/Hour Paid
- Productivity Index
- Customer Concerns
- Perishable Tooling Cost
- Consulting on Machining Processes and Issues
Rework is the most expensive form of waste in any manufacturing facility. We do not pass the cost of rework along to customers. It comes directly out of profits, so we monitor this closely and take corrective action immediately when it occurs.
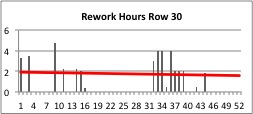
Here is a graph from the WPR that shows rework trends:

Note: Over 52 weeks, there were only 42 total rework hours.
We measure Order Backlog to determine lead time so we don’t give customers false or unrealistic delivery dates. We measure productivity in more than one way to ensure our machinists are delivering the greatest value per hour to our customers.
Customer Concerns is one of our measures of quality. Over 46 weeks of the current year, there were only 3 customer Concerns on over 1800 jobs shipped.
Consulting on Machining Processes and Issues refers to the service Jerry Baase provides to customers who have questions or problems related to machining processes or problems. Jerry works closely with customers to determine the best way to handle the work, and this has saved our customers an untold amount of money as well as time.
In the Shipping Performance Section, we measure:
- Jobs Shipped
- Jobs Shipped Late
- On Time Ship Performance
- Order Velocity (Average Lead Time)
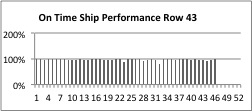
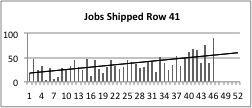
This graph illustrates our on-time shipping performance. The graph next to it shows that we can maintain our enviable 97% on time delivery performance even with an upsurge in business.
|
|
|
Summary: We measure over 40 key metrics on a weekly basis and review these in a staff meeting to evaluate and determine where corrective action may be warranted. This close attention to detail at the management level is also an integral to our shop’s culture. This is why customers continually rely on us for getting what they want, when they want it, at a fair price.

